Get a better understanding of the analytics in eNPS
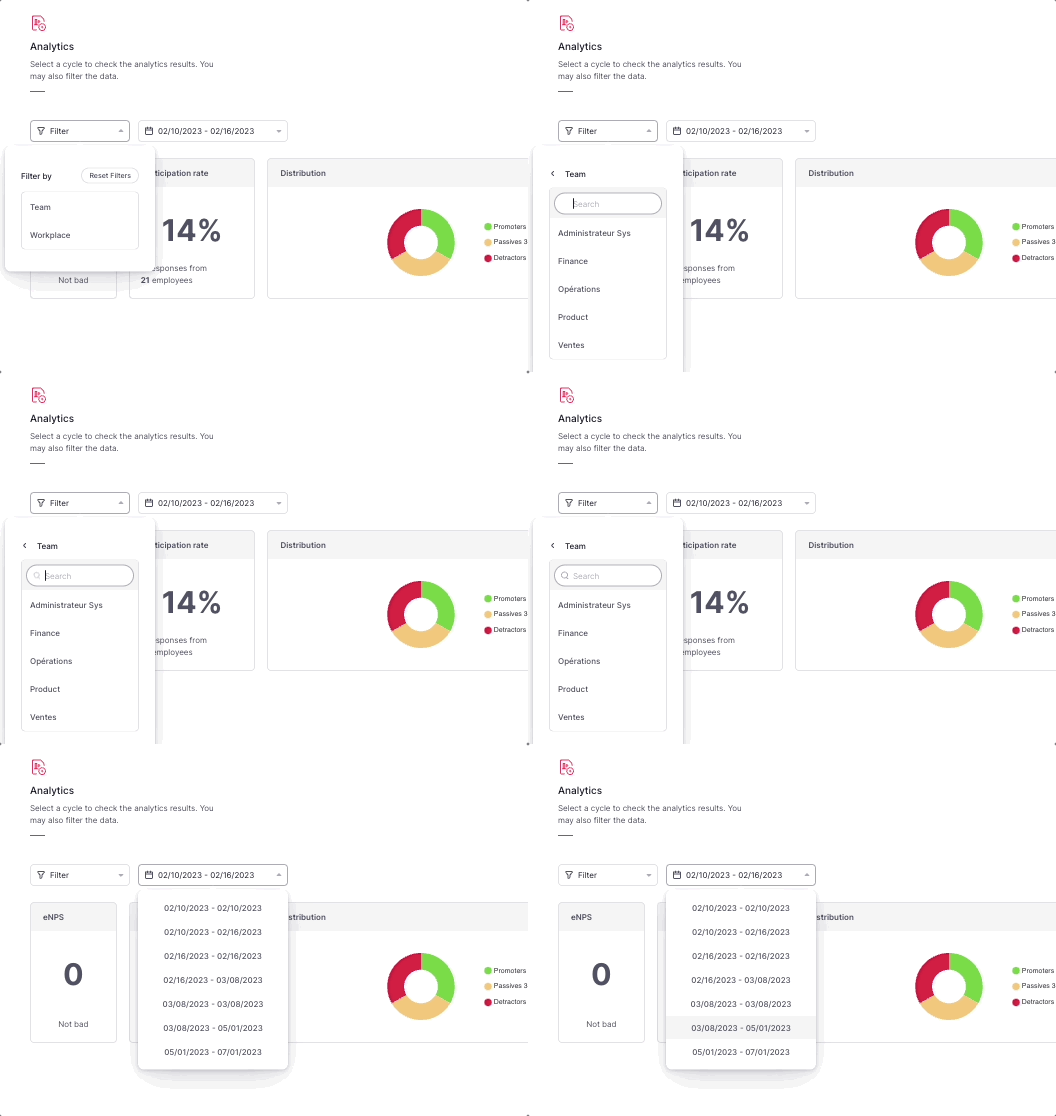
In order to have access to the analytics:
- On your sidebar click on Engagement
- Press on eNPS
- Click on Analytics

Any user who belongs to the Admin permission group or is an assigned supervisor will have access to the analytics. A minimum of three employees must have answered before any data is available in this section.
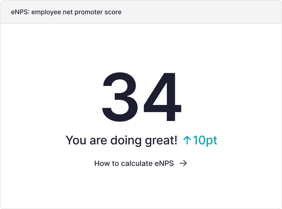
eNPS (Employee Net Promoter Score)
- eNPS: A score is a number between -100 and 100 that is obtained from the following formula:
%promoters - %detractors * 100.
Depending on the score there will be a message displayed, depending on the ranking.
- 60 to -31 = Reason for concern.
- 30 to -1 = Needs improvement.
- 0 to 10 = Not bad.
- 11 to 30 = Good job!
- 31 to 60 = You are doing great!
- 61 to 100 = Totally amazing!
The difference with the result of the previous cycle is shown.

-
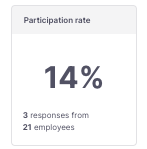
Participation rate: A percentage of responses out of a total number of employees.

-
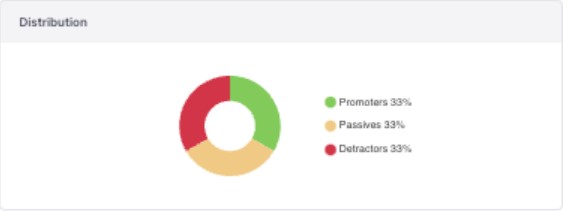
Distribution: Pie chart that displays the ratio of employees who are promoters, neutral, and detractors. It also includes unanswered surveys.

- It’s possible to filter the analytics by teams and workplaces and filter by cycles as well.
